
Observability Module
OpenTelemetry and Prometheus observability for Ignition 8.3
Export curated gateway metrics and logs to Grafana, Datadog, New Relic or Azure Monitor over OpenTelemetry, or let Prometheus scrape the gateway directly. No wrapper.conf surgery, no sidecar agent to own.
Free in Ignition trial mode · €800 per gateway, perpetual · Basic Care updates 20% per year
What this module gives you
Every gateway signal, one module
Metrics, logs, traces and opt-in audit records leave the gateway through one pipeline. Log events arrive with the logger, the thread, MDC context and the full exception, so wrapper.log stops being the place you go to find out what broke.
A curated metric catalog
The gateway registry holds more than 300 raw internal names, and they change between Ignition versions. This module publishes 138 documented, low-cardinality names, curated from that registry or read from gateway state it does not hold. They stay the same across Ignition versions, so the dashboard you build today still works after the next Ignition upgrade. A firehose of internal names is not a dashboard.
Push to the backend you already run
OTLP over HTTP/protobuf to Grafana Cloud, Datadog or New Relic, and native ingestion into Azure Monitor, each tested against a live account, through a proxy if your plant needs one. Or let Prometheus scrape the gateway on :9464. Test Connection proves a destination works before you save it, so a typo in a token is not something you discover a week later.
You decide what leaves the gateway
Logger exclusions and a hard rate limit cap what your backend bills you for, and dropped events are counted rather than lost quietly. User names can be pseudonymised and IP addresses redacted, and a minimal data profile sets a floor that a settings lock stops anyone loosening from the page.
Collectors for what the registry misses
Live alarm counts by state and priority, OPC connection and device states, MQTT diagnostics for Cirrus Link, the redundancy role, the platform licence and installed modules, and the gateway's own problem list. The gateway keeps none of this in its metric registry. Polled collectors read it anyway, so a device that dropped an hour ago is a graph line rather than a phone call.
Made by Ignition integrators
We build and run Ignition systems for a living. These dashboards are the ones we keep open on our own customers' gateways, and support comes from the people who wrote the module.
What it watches
Gateway JVM, GC and host · Query, script and historian latency · Databases, per datasource · Gateway network · Perspective · Projects and configuration · Scripting and Designer · Scripts per project · Historian · Tags · Store and forward · Redundancy role and queues · MQTT (Cirrus Link) · Alarms by state, and alarm floods · OPC connections · Device connections · Licence, edition and modules · Gateway problems · Certificate expiry · Scheduled backups
138 documented metric names across these subsystems, plus every gateway log.
Anything else a gateway exposes can be added, SQL Bridge, EAM and Sepasoft included. A pack is built from metric names captured on a gateway that runs the thing, so if something you depend on is not listed here, ask us to add it.
See every metric, with its type and unit, in Appendix A of the manual

The dashboards ship with it
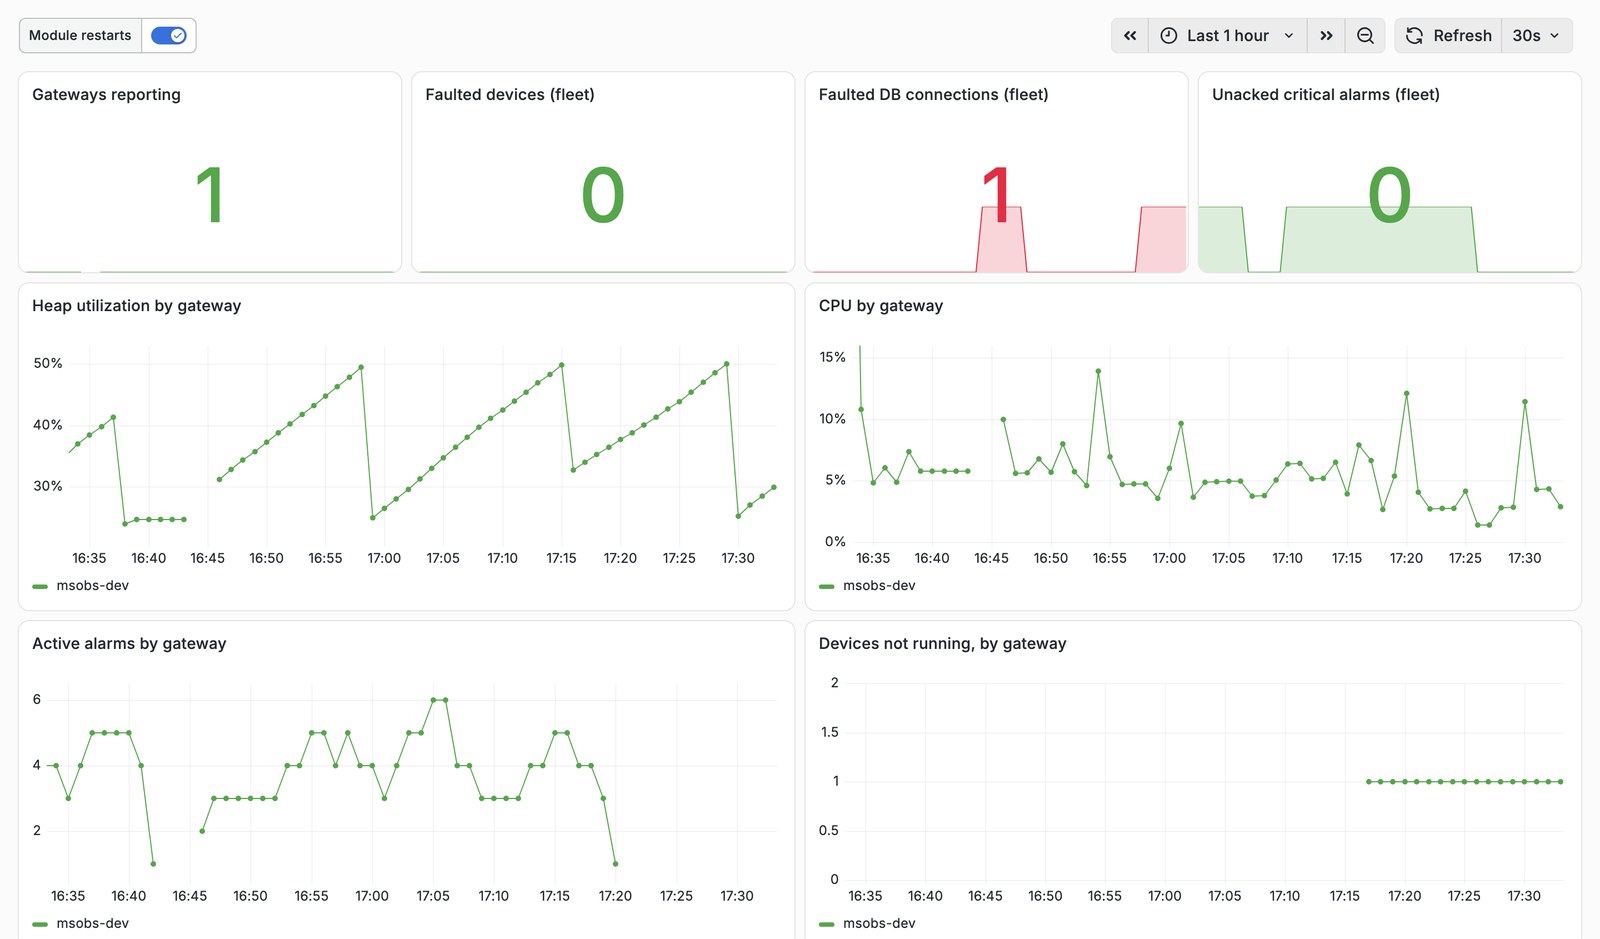
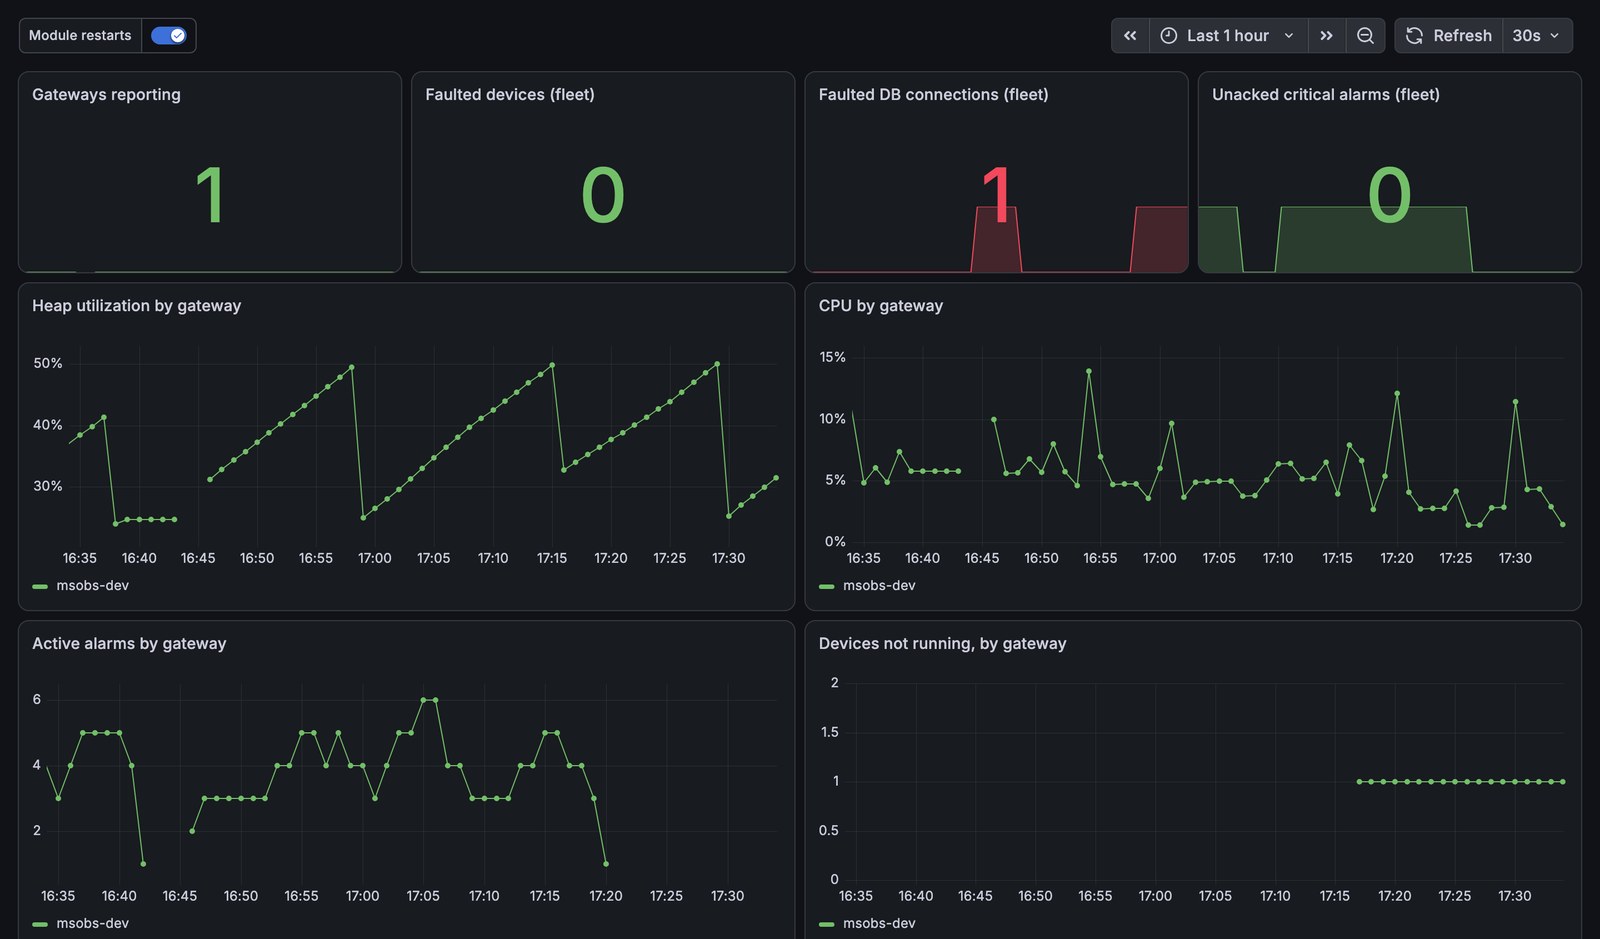
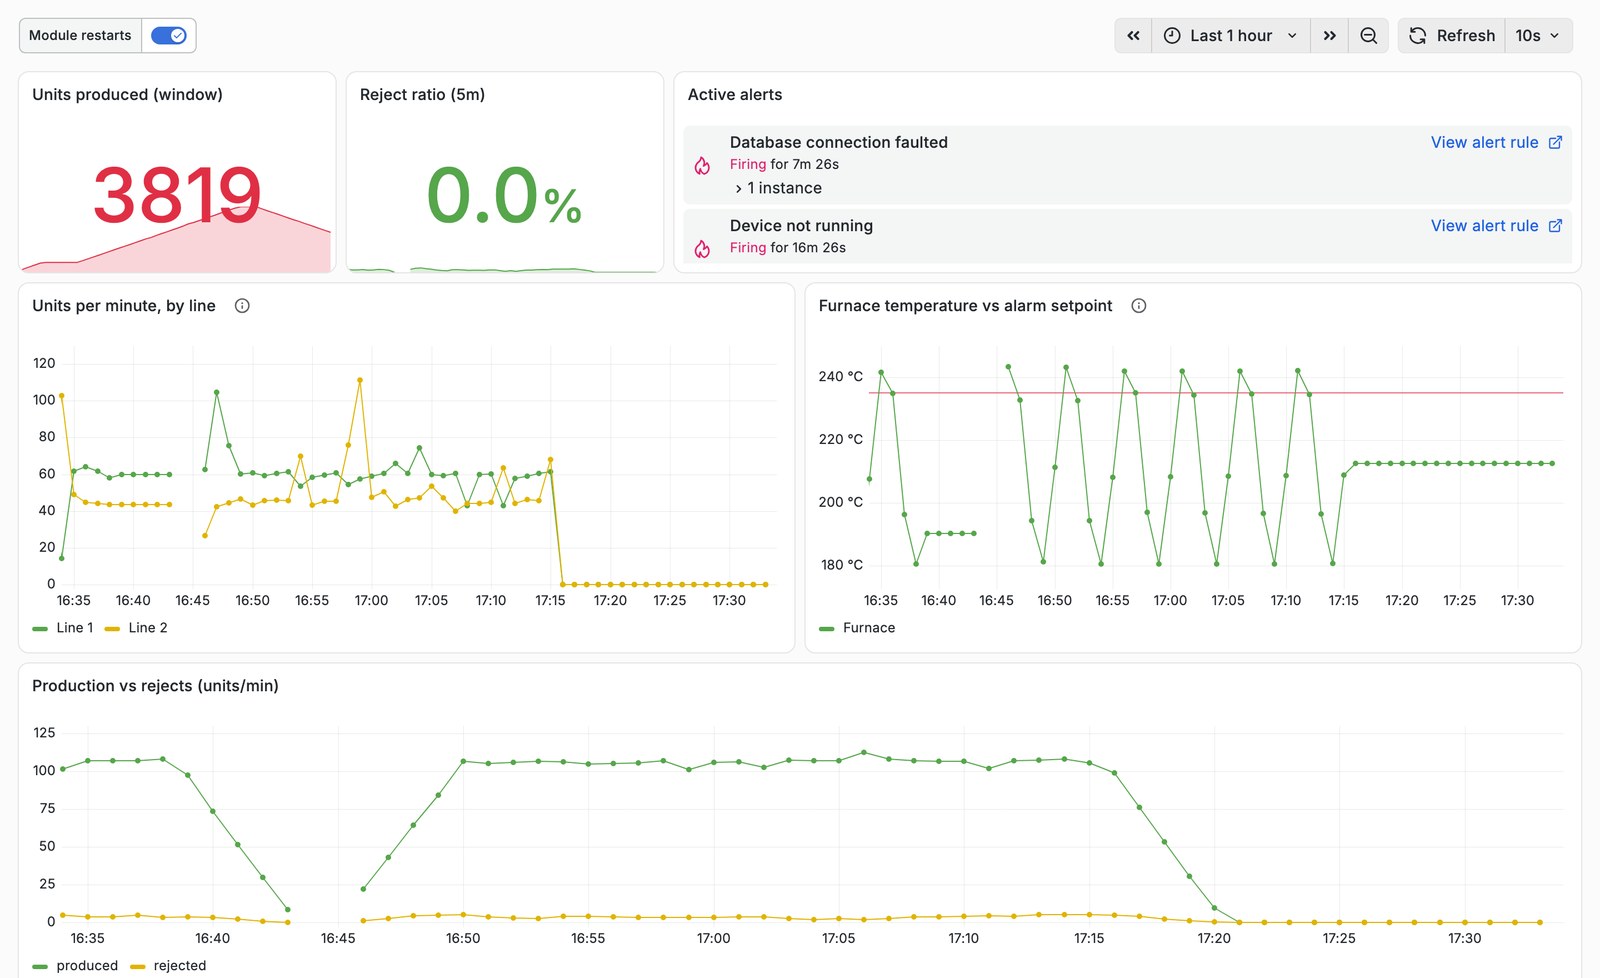
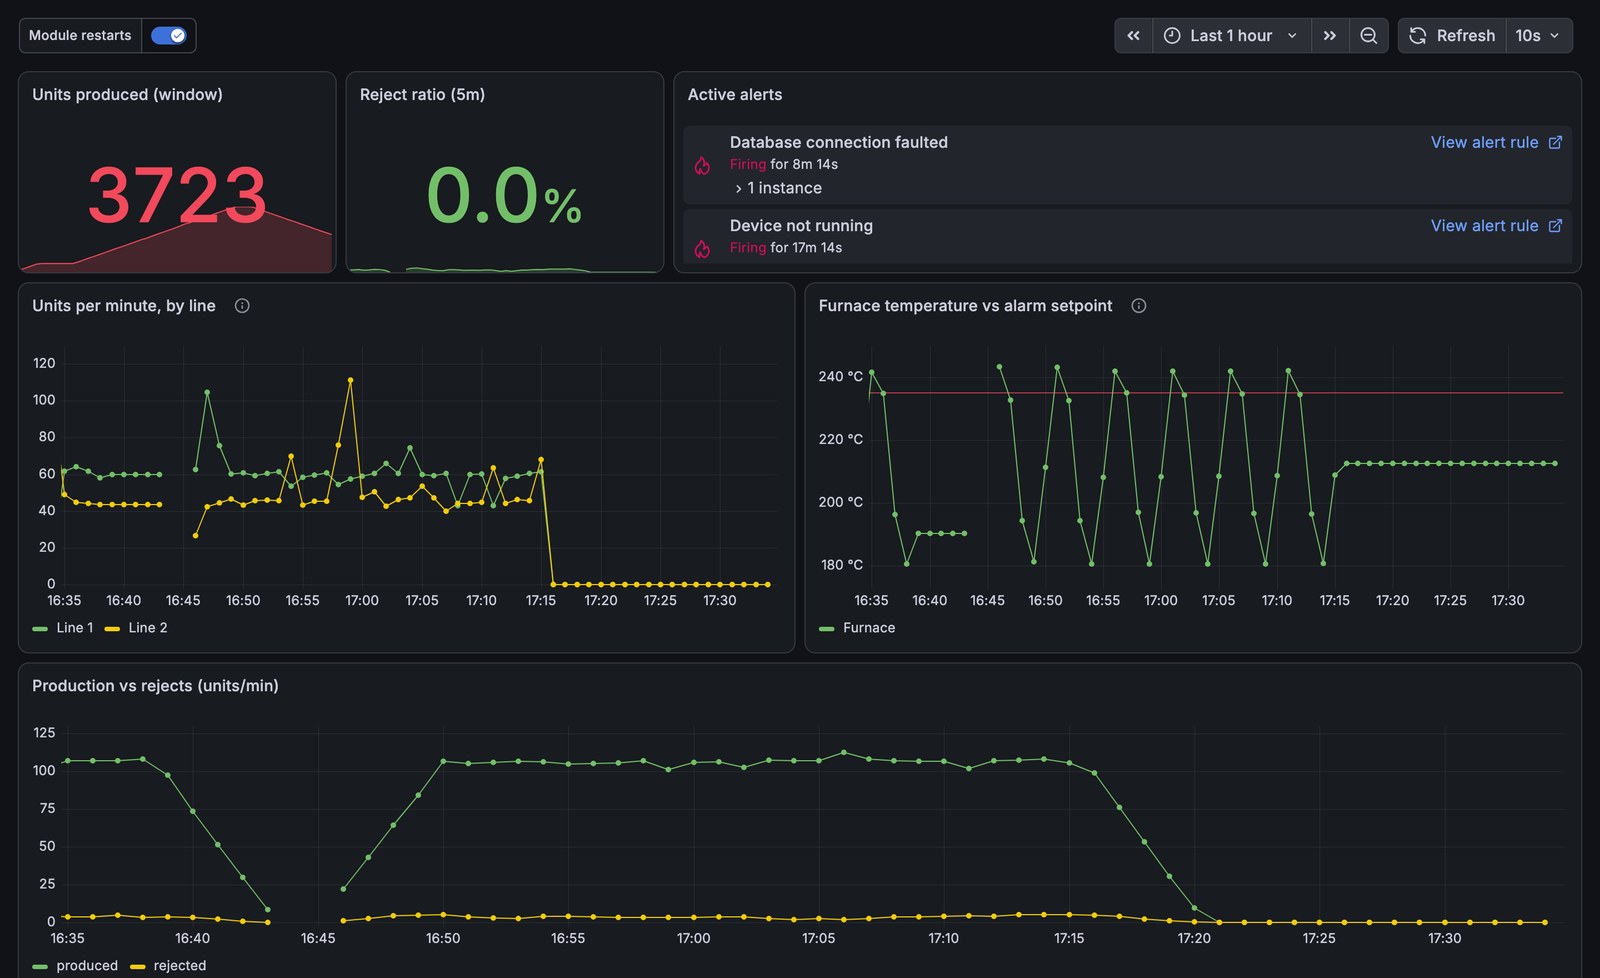
Neither of these was built for the screenshot. They are the Grafana pack that comes in the download, pointed at a gateway that was genuinely in trouble at the time: a database connection down and a device stopped.
Why this module exists
Most teams find out a gateway is in trouble when an operator rings. The gateway usually knew first. Heap had been climbing for a week, a device had been disconnected since the night shift, the store-and-forward queue was growing. All of it sat on a status page nobody had open at 2am. Meanwhile the team that owns uptime is already watching Grafana or Datadog, with alert rules, on-call rotations and a year of history, and the gateway is the one box missing from all of it. Closing that gap by hand means JVM exporters, wrapper.conf edits and a log shipper that nobody owns by the second year. This module makes gateway telemetry part of the gateway. Install it, point it at a destination, and gateway health turns up beside the rest of your infrastructure, where somebody is already looking.
What you get
An Ignition module, a user manual whose appendix lists every metric with its type and unit, and a Grafana pack with dashboards and alert rules, so the first thing you see is a working dashboard rather than an empty data source. Configuration lives in the gateway web UI under Platform, Observability. Saves apply straight away, with no gateway restart. JVM system properties override the UI when you run containers or a fleet, so a hundred gateways do not need a hundred visits. system.observability.* publishes your own counters and gauges down the same pipe, which puts a line KPI next to gateway heap in one backend. Updates come through our Basic Care module at 20% of the module price per year. You do not have to take our word for any of this before paying: the module runs in full under Ignition's standard module trial, and every setting survives when the trial lapses, so buying later picks up where the trial left off.
What it costs the gateway
We measured it rather than guessing. On a gateway running Ignition 8.3.6 with active devices, two historians and MQTT, sampled with the module installed and again with it removed, the default configuration adds about 0.01 CPU cores and no memory we could measure. That same gateway used about 0.10 cores sitting idle, so the module costs roughly a tenth of what the gateway spends doing nothing at all, or a quarter of one percent of a four-core server. Export Raw Metrics is the one exception, at about 0.06 cores and 230 MiB, which is why it is a debugging switch you turn off again rather than a setting to leave on. We re-measure after every significant change to the module, and the figures are indicative rather than a guarantee.
Running Ignition Edge?
Contact Mustry Solutions before you deploy the module on an Ignition Edge gateway, so we can check your setup with you first.
Request Observability Module
€800Fill in the form and we will be in touch with purchase information.